Add a Visual to a Single Tool Company Report
Objective
To add a visual to a single tool report.
Things to Consider
Required User Permissions:
To add a visual to a single tool company report that you created:* 'Standard' level permissions or higher on the company's 360 Reporting tool.
AND* One of the following permissions for the tool being used as the data source:* If you are creating a report for the Directory tool, 'Admin' level permission on the Directory tool.* If you are creating a report for a Core, Project Management, or Quality & Safety tool, 'Read Only' level permission or higher on the tool being used as the data source.* If you are creating a report for a Financial Management tool, 'Standard' level permission or higher on the tool being used as the data source.To add a visual to a cloned single tool company report:* Access to the cloned copy as its creator. See Copy a Company Single Tool Report.
Note: If a visual was added to the original report before you cloned the report, your cloned copy will include the original visual. You can remove the original visual from your cloned copy of the report and add your own visual.
Additional Information:
The Add Visual button is only visible and available when the report's data set has fewer than 2500 records. See Why do I not see the Add Visual option on my report?
If your report has multiple tabs, each tab can include a maximum of one (1) visual.
Steps
Navigate to the Company 360 Reporting tool.
In the Reports tab, locate the desired report.
Click the report to open it.
Click + Add Visual.
Enter a name for your new visual in the Descriptive Title box.
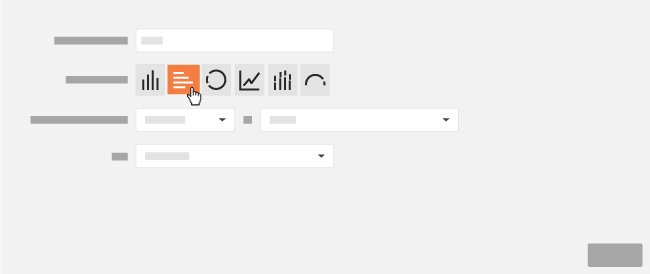
Next to Type of Visual, click the desired button to specify which visual to create.
Note: Depending on the visual, you will have the ability to select different measures on which the report's calculations can be made.
Click Save.
Optional: If you want export your report with your new visual, click Export and select PDF with Visuals.